Job satisfaction is an individual’s level of fulfillment with their job. It’s influenced by various factors like work environment, relationships with colleagues and management, nature of work, salary and benefits, career advancement opportunities, job security, a work-life balance, etc. Job satisfaction can significantly impact an individual’s well-being and overall quality of life on the one hand and productivity and overall organizational success on the other hand.
So, this article reveals job satisfaction statistics you should know in 2025. We will examine what factors influence the level of job satisfaction the most, the importance of management, work arrangements, time off and stress at work, and other aspects.
Core job satisfaction facts
50% of Americans say they are extremely or very satisfied with their current job, with 38% being somewhat satisfied and 12% being not too or not at all satisfied. Still, this percentage varies depending on the role itself, working conditions, and salary. [1]
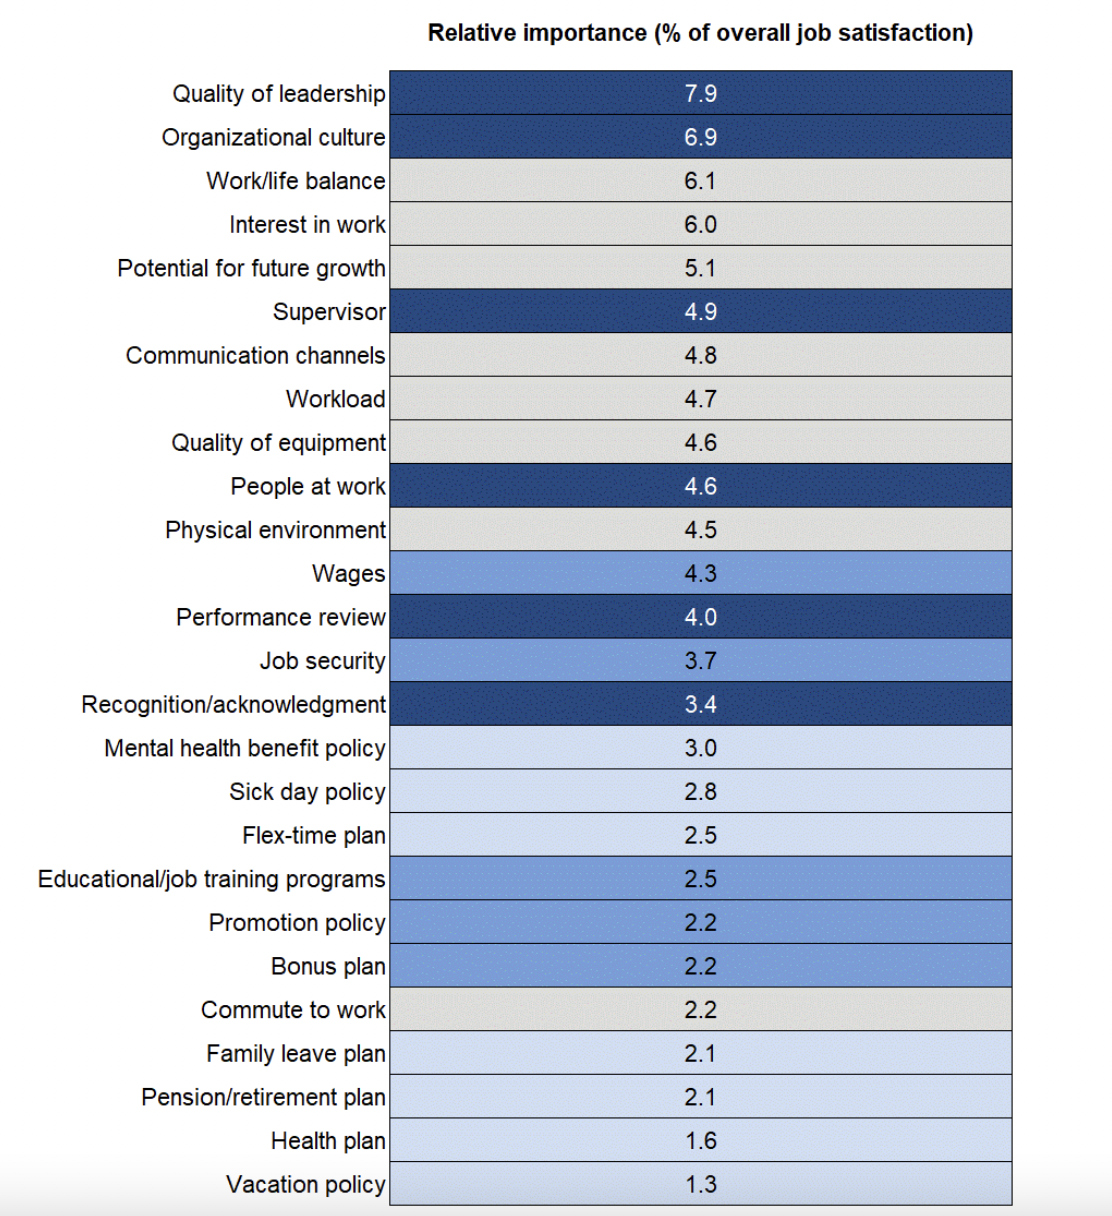
Interest in work, quality of leadership, organizational culture, workload, and recognition are the most important determinants of job satisfaction, according to The Conference Board’s 2025 survey. Leadership and culture remain among the strongest predictors of overall satisfaction and engagement. [2]
Overall job satisfaction spiked by 5.7 percentage points in The Conference Board’s 2025 survey—the largest single-year jump in the survey’s history—reaching the highest level recorded since the survey began in 1987. Workers reported higher satisfaction across 26 of 27 elements, declining only in quality of equipment. A resilient labor market and stronger emphasis on employee retention helped drive these gains. [2]
39% of people say their job is very important to their overall identity with 34% saying it is somewhat important and 27% reporting it’s not too or not at all important.
Almost 50% of Americans view their job as a career and 18% say it is a stepping stone to a career. Meanwhile, 30% describe their job as “just a job to get them by,” rather than a career, which is three in ten workers. However, 58% of workers with lower incomes say their job is just something to get them by, compared with 31% of those with middle incomes and 17% of those with higher incomes. [1]
About 63% of workers say they’re unlikely to look for a new job in the next six months, but a significant minority—25%—plan to explore other options, with 12% undecided. Globally, about 50% of workers are either watching for or actively seeking new employment. Meanwhile, 52% of workers say it would be difficult for them to find the kind of job they want, up from 37% in 2022. [1] [4]
Three main reasons for seeking a new job are increased pay, improved well-being, and new opportunities to grow professionally.
Employee engagement
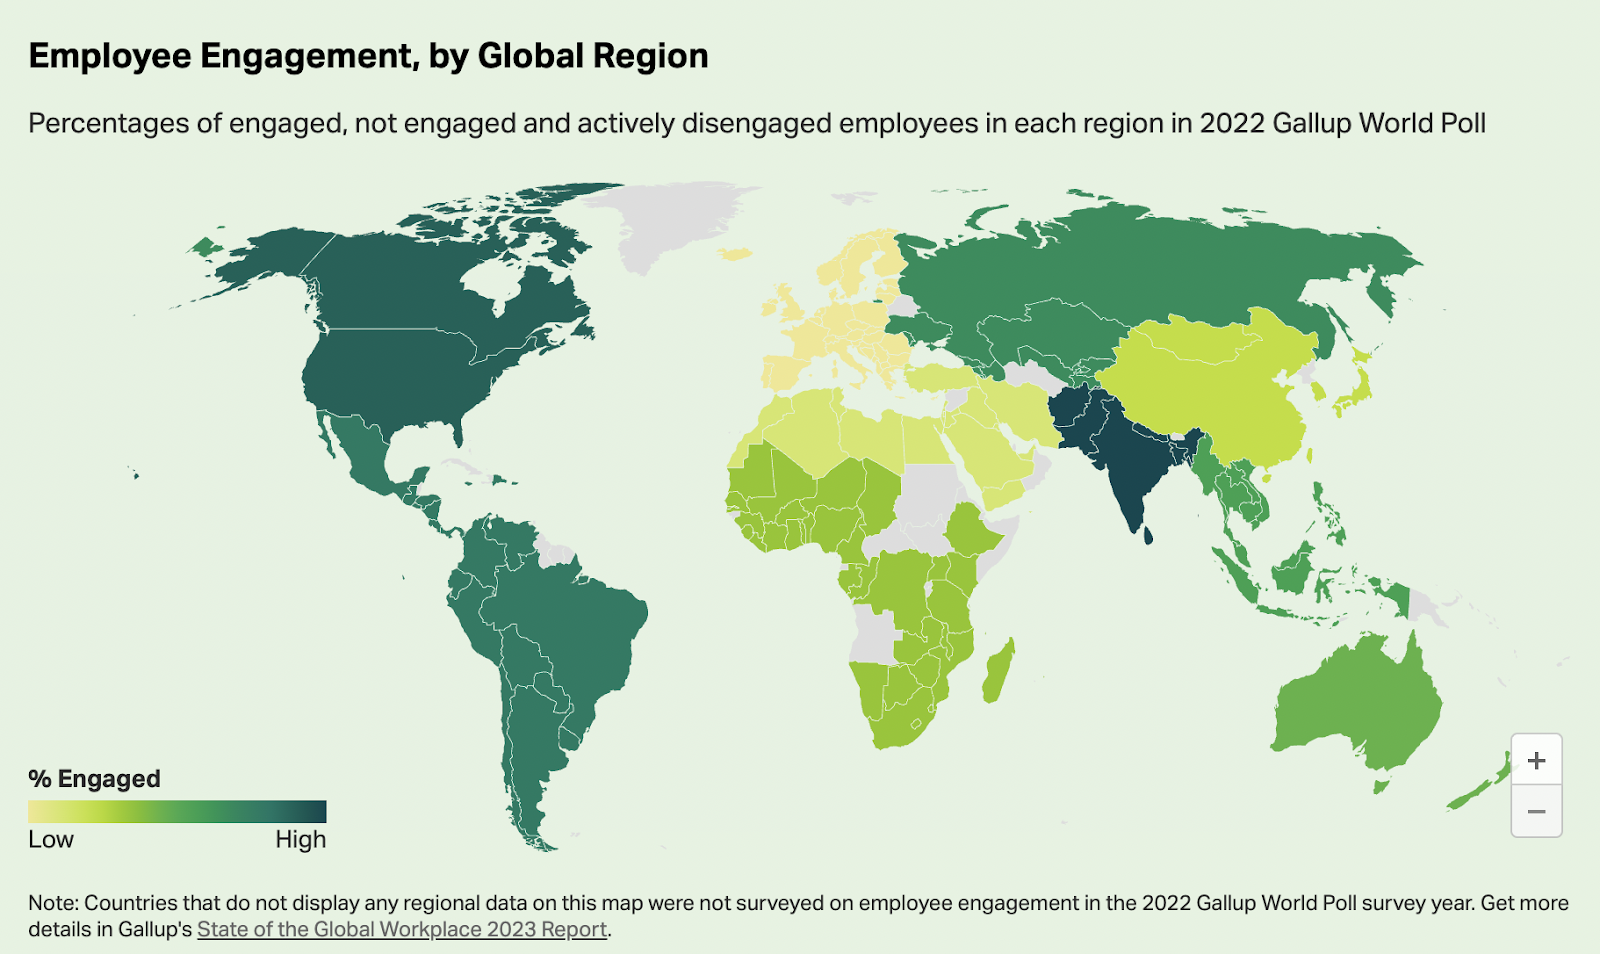
In 2024, global employee engagement fell from 23% to 21%—only the second decline in the past 12 years, matching the drop seen during COVID-19 lockdowns. This decline cost the global economy an estimated $438 billion in lost productivity. [4]
The US and Canada, along with Latin America and the Caribbean, now lead global engagement at 33% each (the first time Latin America has tied with North America). South Asia also remains above the global average. Europe continues to have the lowest engagement, at just 13%, with the UK recording only 10% of workers as engaged. [4]
On the other hand, 62% of employees around the world are “not engaged”—often described as “quiet quitters.” This means they formally do their work but they don’t actively engage in the process and see no connection to their job or team. Meanwhile, 17% are actively disengaged. The key driver behind the 2024 decline was a sharp drop in manager engagement, which fell from 30% to 27%. Managers under 35 saw engagement fall by five percentage points, and female manager engagement dropped by seven points. [4]
Disengaged employees cost the world an estimated $8.8 trillion in lost productivity annually. Meanwhile, Gallup estimates that if every organization reached the engagement levels of today’s best-practice companies (around 70%), the world economy could grow by an additional $9.6 trillion—a 9% boost in global GDP. Highly engaged teams show 23% greater profitability, 51% lower turnover, and 68% better employee well-being. [4]
Hybrid vs remote vs office
Hybrid workers report the highest engagement rates among remote-capable employees. As of 2024, Gallup data shows hybrid workers at 35% engagement, fully remote employees at 33%, and on-site workers at 27%. Six in ten employees with remote-capable jobs prefer a hybrid arrangement, about a third prefer fully remote, and less than 10% prefer working entirely on-site. [4] [8]

If flexible work were taken away, almost half (40%) of workers would start job hunting, 22% would expect a raise, and 5% would quit outright. A Stanford/Nature randomized trial found that employees who work from home two days a week are just as productive and as likely to be promoted as fully office-based peers, while resignations fell by 33% among workers who shifted to a hybrid schedule. [8] [9]
Stress at work
In 2024, 41% of employees globally reported experiencing “a lot of stress” the previous day, slightly down from 44% in 2022 but still well above pre-pandemic levels. In the US and Canada, this figure jumps to nearly 50%—the highest of any region globally. [4]
77% of American workers reported experiencing work-related stress in the past month, according to the APA’s Work in America Survey. About 75% of employees say stress hurts their sleep and 60% say it affects their relationships. [5]
In the UK, nearly 964,000 workers were suffering from work-related stress, depression, or anxiety as of 2024/25, contributing to 22.1 million lost working days. Stress-related cases average 22.9 days off per case—far longer than physical injury absences. Meanwhile, 48% of workers globally are grappling with burnout according to a Boston Consulting Group study, with women, LGBTQ+ employees, people with disabilities, and deskless workers experiencing rates up to 26% higher than average. [6] [10]
Overworking and time off
55% of employees reported responding to work emails outside of their normal hours at least sometimes, with 28% saying they do so often. Meanwhile, 33% say they rarely or never respond to work emails or messages outside of their work hours. [1]
48% of US workers say they typically take all the time off they have, while 46% say they take less time off than they are allowed. 52% say they don’t feel they need to take more time off, while 49% say they do not take more time off as they worry about falling behind at work. 43% say they would feel badly about their co-workers having to take on additional work. Research shows that paid time off significantly reduces job hopping—voluntary turnover dropped by 35% among those offered PTO. [1]
Job satisfaction and management
80% of people who are satisfied with their management are likely to stay at their current job, compared with 27% who aren’t.
40% of employees who do not rate their managers highly have been interviewed for a new job in the last three months — compared to just 10% for those who do rate them highly. [7]
21.5% of employees who don’t feel recognized when they do great work have been interviewed for a job in the last three months — compared to just 12.4% who do feel recognized.
Managers account for 70% of the variance in team engagement, making them the most critical lever for organizational performance. Globally, only 44% of managers report having received any management training. However, those who receive training see active disengagement cut in half, and when employers combine training with ongoing development support, manager well-being (“thriving”) increases from 28% to 50%. [4]
Meanwhile, people in a manager role are more likely to like their jobs, compared to non-managerial workers. These are 69% of managers reported to like (50%) or love (19%) their current job, while only 59% of non-managers like (41%) or love (18%) their current job.
In the UK, 26% of managers or supervisors report having no formal training before they became managers, while just 35% of managers enjoy regular management training. Furthermore, 52% of managers say their normal workload wasn’t reduced when they first became a manager. [11]
Job satisfaction and age & gender
In 2025, The Conference Board found a striking 15-point gap in job satisfaction between the oldest and youngest generations: only 57.4% of workers under 25 are satisfied with their jobs, compared to 72.4% of those aged 55 and older. Workers under 25 were the only age group to see a decline in satisfaction. [2]
In the US, the Pew Research Center’s 2024 survey shows workers aged 65 and higher remain the most likely to report being extremely or very satisfied with their job (67%), compared to 43% of people younger than 30. Meanwhile, 56% of workers 50 to 64 and 48% of people 30 to 49 say they are extremely or very satisfied with their job. White workers are the most likely to say they are very satisfied (55%), compared with 44% of Hispanic, 43% of Black, and 42% of Asian workers. [1]
Men are more satisfied than women with 64% of overall job satisfaction compared to 60.1%, with wide gaps in job security, core benefits, communications, and mental health benefit policies. Women earned an average of 85% of what men earned in 2024, according to Pew Research Center, up slightly from 81% in 2003. [1] [12]
Meanwhile, 23% of women reported being discriminated against or being treated unfairly because of their gender, compared with 10% of men.

Sources
[1] Pew Research Center — Most Americans Feel Good About Their Job Security but Not Their Pay (2024)
[2] The Conference Board — Job Satisfaction 2025: US Worker Satisfaction Rebounds Sharply
[3] PwC UK — Workforce Survey 2022
[4] Gallup — State of the Global Workplace Report (2025)
[5] American Psychological Association — Work in America Survey
[6] UK Health and Safety Executive — Work-Related Stress, Anxiety and Depression Statistics (2024/25)
[7] TINYpulse — Employee Retention Report
[8] Owl Labs — State of Hybrid Work Report (2025)
[9] Stanford University / Nature — Hybrid Work Study (2024)
[10] Boston Consulting Group — Managing Workplace Burnout (2024)
[11] Digits — Management Training Survey Results
[12] Pew Research Center — Gender Pay Gap in the US (2025)